How to Debug Javascripts - Part1 (Internet Explorer)
With IE you can use Microsoft Script debugger and Visual Studio as debuggers.
You can download it form Microsoft website.
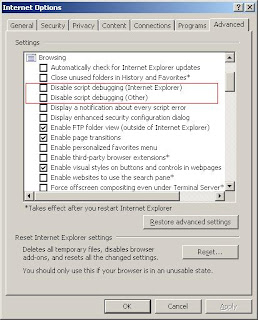
To use the debugger, first you have to enable script debugging. Go to tools- options- tab. Make sure that “Disable Script Debugging (other)” and “Disable Script Debugging (Internet Explorer) are NOT checked.

Now you are ready to debug. Use View- View- Debugger- at next statement to run Debugger. This will break the execution on the next Javascript call and will open the debugger.

Alternately, you can put a line like this in your Javascript code.
debugger;
It will create a breakpoint automatically.

If any exceptions occurred in javascript execution IE will show a message asking whether to debug or not.

Select yes. Then it will display possible set of debuggers.

Now you are debugging. Just step into as you do in any 0ther debugger.

You can use command window to to execute codes. From this little window you can easily check and re-assign values (at "run-time") to any of the variables that have been defined. Launch it from the View menu of the debugger or by clicking the button on the very right-hand-side of the toolbar.

I created a webpage which contains buggy Javascript. If you wish you can use that to test the debugging.
http://sandarenu.googlepages.com/javascriptdebugg


