Showing posts with label Javascript. Show all posts

How to Debug Javascripts - Part2 (Firefox)

This is the part of the my How to debug Javascripts artical. This one will explain how to debug on Firefox using Firebug. See my previous artical on how to debug in Internet Explorer.

Firebug is not only a javascript debugger, it is a complete web debugging tool where you can explore the html DOM and much much more. And it is very easy to use. Once you install Firebug you will get a menu item in under the Tools menu. Using that you can enable and disable firebug for selected sites.


Once you open the Firebug you can inspect the javascripts under the Script tab and do the debugging. You can put breakpoints just by clicking the near the line number.


One special thing with Firebug is that you can put conditional break points. To add conditional break points just right click near the line number you want to put the break point and type your condition.


When there are Javascript errors in the page it is shown in the Firefox status bar. Once you click on that it will open all the errors in the console with possible reasons for that error. This will be very useful for you to find bugs in your application.


You can get more information on Firebug for Firebug site.


Technorati Tags: , ,
 

How to Debug Javascripts - Part1 (Internet Explorer)

If you are involved with web development then at some point you may wanted to debug Javascripts that you put in to your web pages. The problem is how to debug them. When I first started using Javascripts few month back I didn't knew a debugger to use with Javascripts. So what I did was to put alerts every where to find out the problem. But that was not a good method. So I did a research on Javascript debuggers. After few minutes of Google search I found few good tool that can be used to debug Javascripts. With this post I'll show you how debug in Internet Explorer, and later with another post I'll explain how to debug with Firefox.

With IE you can use Microsoft Script debugger and Visual Studio as debuggers.

You can download it form Microsoft website.
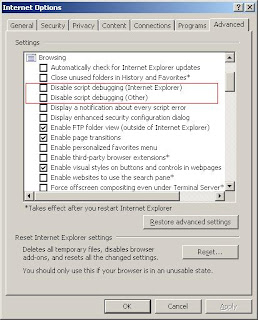
To use the debugger, first you have to enable script debugging. Go to tools- options- tab. Make sure that “Disable Script Debugging (other)” and “Disable Script Debugging (Internet Explorer) are NOT checked.


Now you are ready to debug. Use View- View- Debugger- at next statement to run Debugger. This will break the execution on the next Javascript call and will open the debugger.


Alternately, you can put a line like this in your Javascript code.
debugger;
It will create a breakpoint automatically.


If any exceptions occurred in javascript execution IE will show a message asking whether to debug or not.


Select yes. Then it will display possible set of debuggers.


Now you are debugging. Just step into as you do in any 0ther debugger.


You can use command window to to execute codes. From this little window you can easily check and re-assign values (at "run-time") to any of the variables that have been defined. Launch it from the View menu of the debugger or by clicking the button on the very right-hand-side of the toolbar.


I created a webpage which contains buggy Javascript. If you wish you can use that to test the debugging.
http://sandarenu.googlepages.com/javascriptdebugg